Three.js is a javascript library that enables developers to create 3D graphics in-browser. It relies on WebGL, SVG and HTML5 canvas. Three has been used in several recent Chrome Experiments which has led to it becoming the go-to library for generating web-based 3D graphics. The documentation has some pretty big holes in right now but examples are available at threejs.org that can help you to get started.
The majority of aspects you would expect to find in a 3D software program are supported. The only thing that's really holding back the 3D web right now is that it's quite processor heavy. Some of the shaders, and post processing options you can include can increase page load times substantially.
We wanted to use cutting-edge technology in creating this project. Therefore we decided to use Three.js to create a visualisation, hoping it would provide the 'wow' factor we were aiming for. The visualisation is based around ideas such as the 'Six Degrees of Separation'. We planned to demonstrate how frequently people come in contact with one another, mapping out those who are least separated, to those who are most separated from the rest of human civilisation.
Initial thoughts
When discussing how we could visualise levels of separation I found myself thinking of using some sort of 'solar-scape' visual. So people with the most connections would be in the middle, and then people with fewer connections would radiate out from the centre. Each person would be represented by an orb, and each orb would have lines connecting them to anyone who had come into close proximity. These lines would be opaque, and the level of opacity would be judged by the frequency that connection has been made.
In theory, everybody would need to be tracked in order to perform this experiment so we are only going to be able to create a limited demonstration of the experiment. We will include an option to display a visualisation based on dummy data for a significant amount of people as well as a live version.
Getting Started
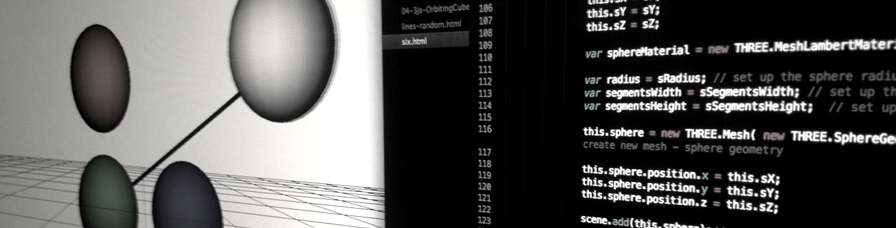
The best way to get started with three.js was to follow the basic usage tutorial on the github repository. This provides a basic set up for creating a scene, including a camera, a cube mesh, and some basic animation. From here I moved on to experimenting with different meshes such as spheres, basic particle systems, and some more complex animations. These experiments consisted mainly of sphere or cube meshes, to which you could add a material which controls most of the shading and how the shape reacts to light. I was then able to animate these shapes; rotating them and moving them around orbit paths based on some simple trigonometry.
When performing these experiments I was often creating everything from scratch. Since then I came across the three.js boilerplate which I would recommend as a starting point for any three.js project.
Creating the Visualisation
We needed to make sure that we could pull data in from an external source to update the visualisation or else we might have had to go down a different path. Sam set up a node server so that we would be able to communicate using websockets (socket.io). Chris was using arduino to send GPS data to the node server. Luke set up a MongoDB database so that we could store and retrieve the data. So we had data coming in from the arduino, being parsed by the back-end javascript (node.js), which would then be sent to the database. The data was then retrieved again by the node script, and sent via websockets to a web client running Three.js. This all worked successfully, and it was fairly responsive as well which was an added bonus.
I decided to go for a 'low-poly' aesthetic, partly to play on the idea of the 'six' name we had given the project, and also because it helped improve frame rates significantly. So rather than the high resolution, glossy orbs we had floating round at first, I decided to go with the 90's console-esque gem appearance.
Line geometry was used to draw lines to and from the origins of each orb based on whether they had a connection. The opacity of the line was based on how many times the two connected people had been in the same place at the same time.
During testing we were using a wireframe grid as a floor to provide a point of reference if objects were moving. This grid used the plane geometry, of which I found I was able to push vertices up or down. Generating these vertices randomly between two values created a varied terrain. This enhanced the visual as it added to the low-poly appearance and looked less Tron-like than the grid.
Three.js also includes several functions for post-processing the rendered image. For an added level of depth I used the Vignette shader and created a fog so that things fade out in the distance.